Indian Traffic Is the Hardest Computer Vision Problem on Earth
50 million cameras. 300 million vehicles. 50+ vehicle types. No lane discipline. Why existing datasets fail — and why solving Indian traffic means solving everything.
50 Million Cameras. Zero Intelligence.
India has an estimated 50 million CCTV cameras. Nearly every intersection in every major city has at least one. Most of them record to a DVR that nobody watches. When an accident happens, someone scrubs through hours of footage manually. When a vehicle is stolen, an officer sits in front of a screen and squints at blurry plates.
50 million cameras. Zero intelligence.
This is the problem we set out to solve. But the moment we started building, we realized something: the computer vision models that work in San Francisco do not work in Surat.
Why Western Datasets Don’t Transfer
The canonical benchmarks in autonomous driving and traffic perception were built for a different planet.
KITTI (Karlsruhe, Germany): 7,481 training images. Clean roads, lane markings, European vehicles. Traffic participants follow rules. The dataset has 8 object classes. Indian roads have 50+.
nuScenes (Boston, Singapore): 1,000 scenes, 1.4 million 3D bounding boxes. Better diversity than KITTI, but still constrained. Singapore’s traffic is orderly. Boston’s roads are chaotic by American standards — not by Indian standards.
Waymo Open Dataset (Phoenix, San Francisco): 1,950 segments, 12 million 3D labels. The gold standard for autonomous driving research. But every scene assumes lane discipline, traffic signals that are obeyed, and a vehicle taxonomy that tops out at “cyclist.”
BDD100K (Berkeley): 100,000 videos across weather and time-of-day conditions. Good diversity in environment. Zero diversity in traffic behavior. No auto-rickshaws. No bullock carts. No jugaads.
None of these datasets contain a single frame of what Indian roads actually look like.
The Taxonomy Problem
Western traffic datasets operate with roughly 8-15 object classes. Car, truck, bus, pedestrian, cyclist, motorcycle. Maybe a van. This taxonomy is sufficient because Western roads have a limited vehicle vocabulary.
Indian roads do not.
Here is a partial list of vehicle types we detect in production:
| Category | Types |
|---|---|
| Two-wheelers | Motorcycle, scooter, moped, electric scooter, bicycle, e-rickshaw |
| Three-wheelers | Auto-rickshaw, e-rickshaw, tempo, cargo three-wheeler |
| Cars | Hatchback, sedan, SUV, MUV, compact SUV, Maruti Omni, jeep |
| Commercial | Mini truck, LCV, HCV, multi-axle truck, tanker, container truck |
| Public transport | City bus, state bus, school bus, minibus, Volvo/AC bus |
| Agricultural | Tractor, tractor-trolley, harvester, bullock cart |
| Jugaad vehicles | Modified tractor chassis, hand-pulled carts, cycle-rickshaws |
| Ceremonial | Band baarat processions, funeral processions, religious floats |
| Animals | Cow, buffalo, dog, horse, camel, elephant |
| Misc | Handcart, wheelchair, construction vehicle, military vehicle |
That’s 50+ classes before we even get to sub-categories. A YOLO model trained on COCO thinks an auto-rickshaw is a “car” with 40% confidence. A tractor-trolley gets classified as a “truck” — which matters enormously for weight-based toll collection and bridge load analysis.
The Behavior Problem
Even if you solve the taxonomy, you still have not solved Indian traffic. Because the behavior is fundamentally different.
No lane discipline. On a four-lane highway, you will regularly see six lanes of traffic. Vehicles create lanes dynamically. A motorcycle rides on the painted divider. An auto-rickshaw straddles two lanes. A truck uses the wrong side of the road to overtake.
Mixed traffic. Pedestrians, cyclists, animal-drawn carts, and heavy trucks share the same road. They move at speeds ranging from 2 km/h (bullock cart) to 100 km/h (car on a highway). The speed variance within a single frame can be 50x.
Unpredictable behavior. Vehicles make U-turns across dividers. Motorcycles travel against traffic. Buses stop in the middle of the road. Pedestrians cross six-lane highways without looking. A cow sits down in the fast lane and stays there.
Extreme occlusion. In a dense Indian intersection, a single frame might contain 200+ objects, with 60-70% partially or fully occluded. Three motorcycles riding abreast are a single visual blob. An auto-rickshaw behind a bus is invisible for 30+ frames.
Tracking algorithms trained on MOT17 (which assumes roughly 20-50 objects per frame in pedestrian scenes) collapse under this density.
The Infrastructure Problem
Western traffic datasets assume infrastructure that Indian roads often lack.
- Lane markings: Faded, missing, or ignored.
- Traffic signals: Present but frequently non-functional. Or functional but universally ignored.
- Road surfaces: Potholes, speed breakers (unmarked), unpaved sections, waterlogging.
- Lighting: No street lights in many areas. Extreme glare from oncoming headlights at night. Dust and haze reducing visibility.
- Camera quality: Most Indian CCTV installations use budget cameras. 720p. Poor night vision. Fixed lenses. Compression artifacts from cheap DVRs.
The average frame from an Indian traffic camera is noisier, lower resolution, and more visually complex than anything in KITTI or Waymo.
The Numbers
The scale of India’s traffic problem is staggering:
- 300 million registered vehicles (and growing at 8% annually)
- 170,000 road deaths per year — the highest in the world
- 50 million CCTV cameras installed, almost none with AI
- 11 million traffic violations detected manually in 2023 by Delhi Traffic Police alone
- 6.5 million km of road network
- 68% of freight moves by road
Every one of these numbers represents an opportunity for visual AI. And every one of them requires models that actually work on Indian roads.
Why This Is a Feature, Not a Bug
We chose Indian traffic deliberately. Not because we are Indian (though we are). Because it is the hardest visual environment on Earth.
Consider what “solving” Indian traffic requires:
- Fine-grained classification across 50+ vehicle types with high inter-class similarity
- Dense object tracking with 200+ objects per frame and extreme occlusion
- Behavior understanding without lane structure or traffic rule compliance
- Degraded input handling — low resolution, compression artifacts, poor lighting
- Domain generalization across wildly varying road types, from village roads to expressways
If a model handles all five, it handles anything. A parking lot in Munich is a solved problem. A highway in California is trivial. Even Tokyo’s dense intersections are structured and predictable by comparison.
If it works here, it works everywhere.
What We Are Building
This is why we built drik-bench — a benchmark suite specifically for Indian traffic conditions. We measure what matters:
- Detection across 50+ classes with mAP@50 and mAP@75
- Tracking in dense scenes with IDF1 and HOTA metrics
- ANPR on Indian plates (bilingual, varied formats, degraded conditions)
- Scene understanding — can the system describe what is happening, not just what is present?
We built traffic-chaos-100 — 100 of the most challenging Indian traffic scenes we could find. Scenes that break every existing model. We release it publicly so the community can test against reality.
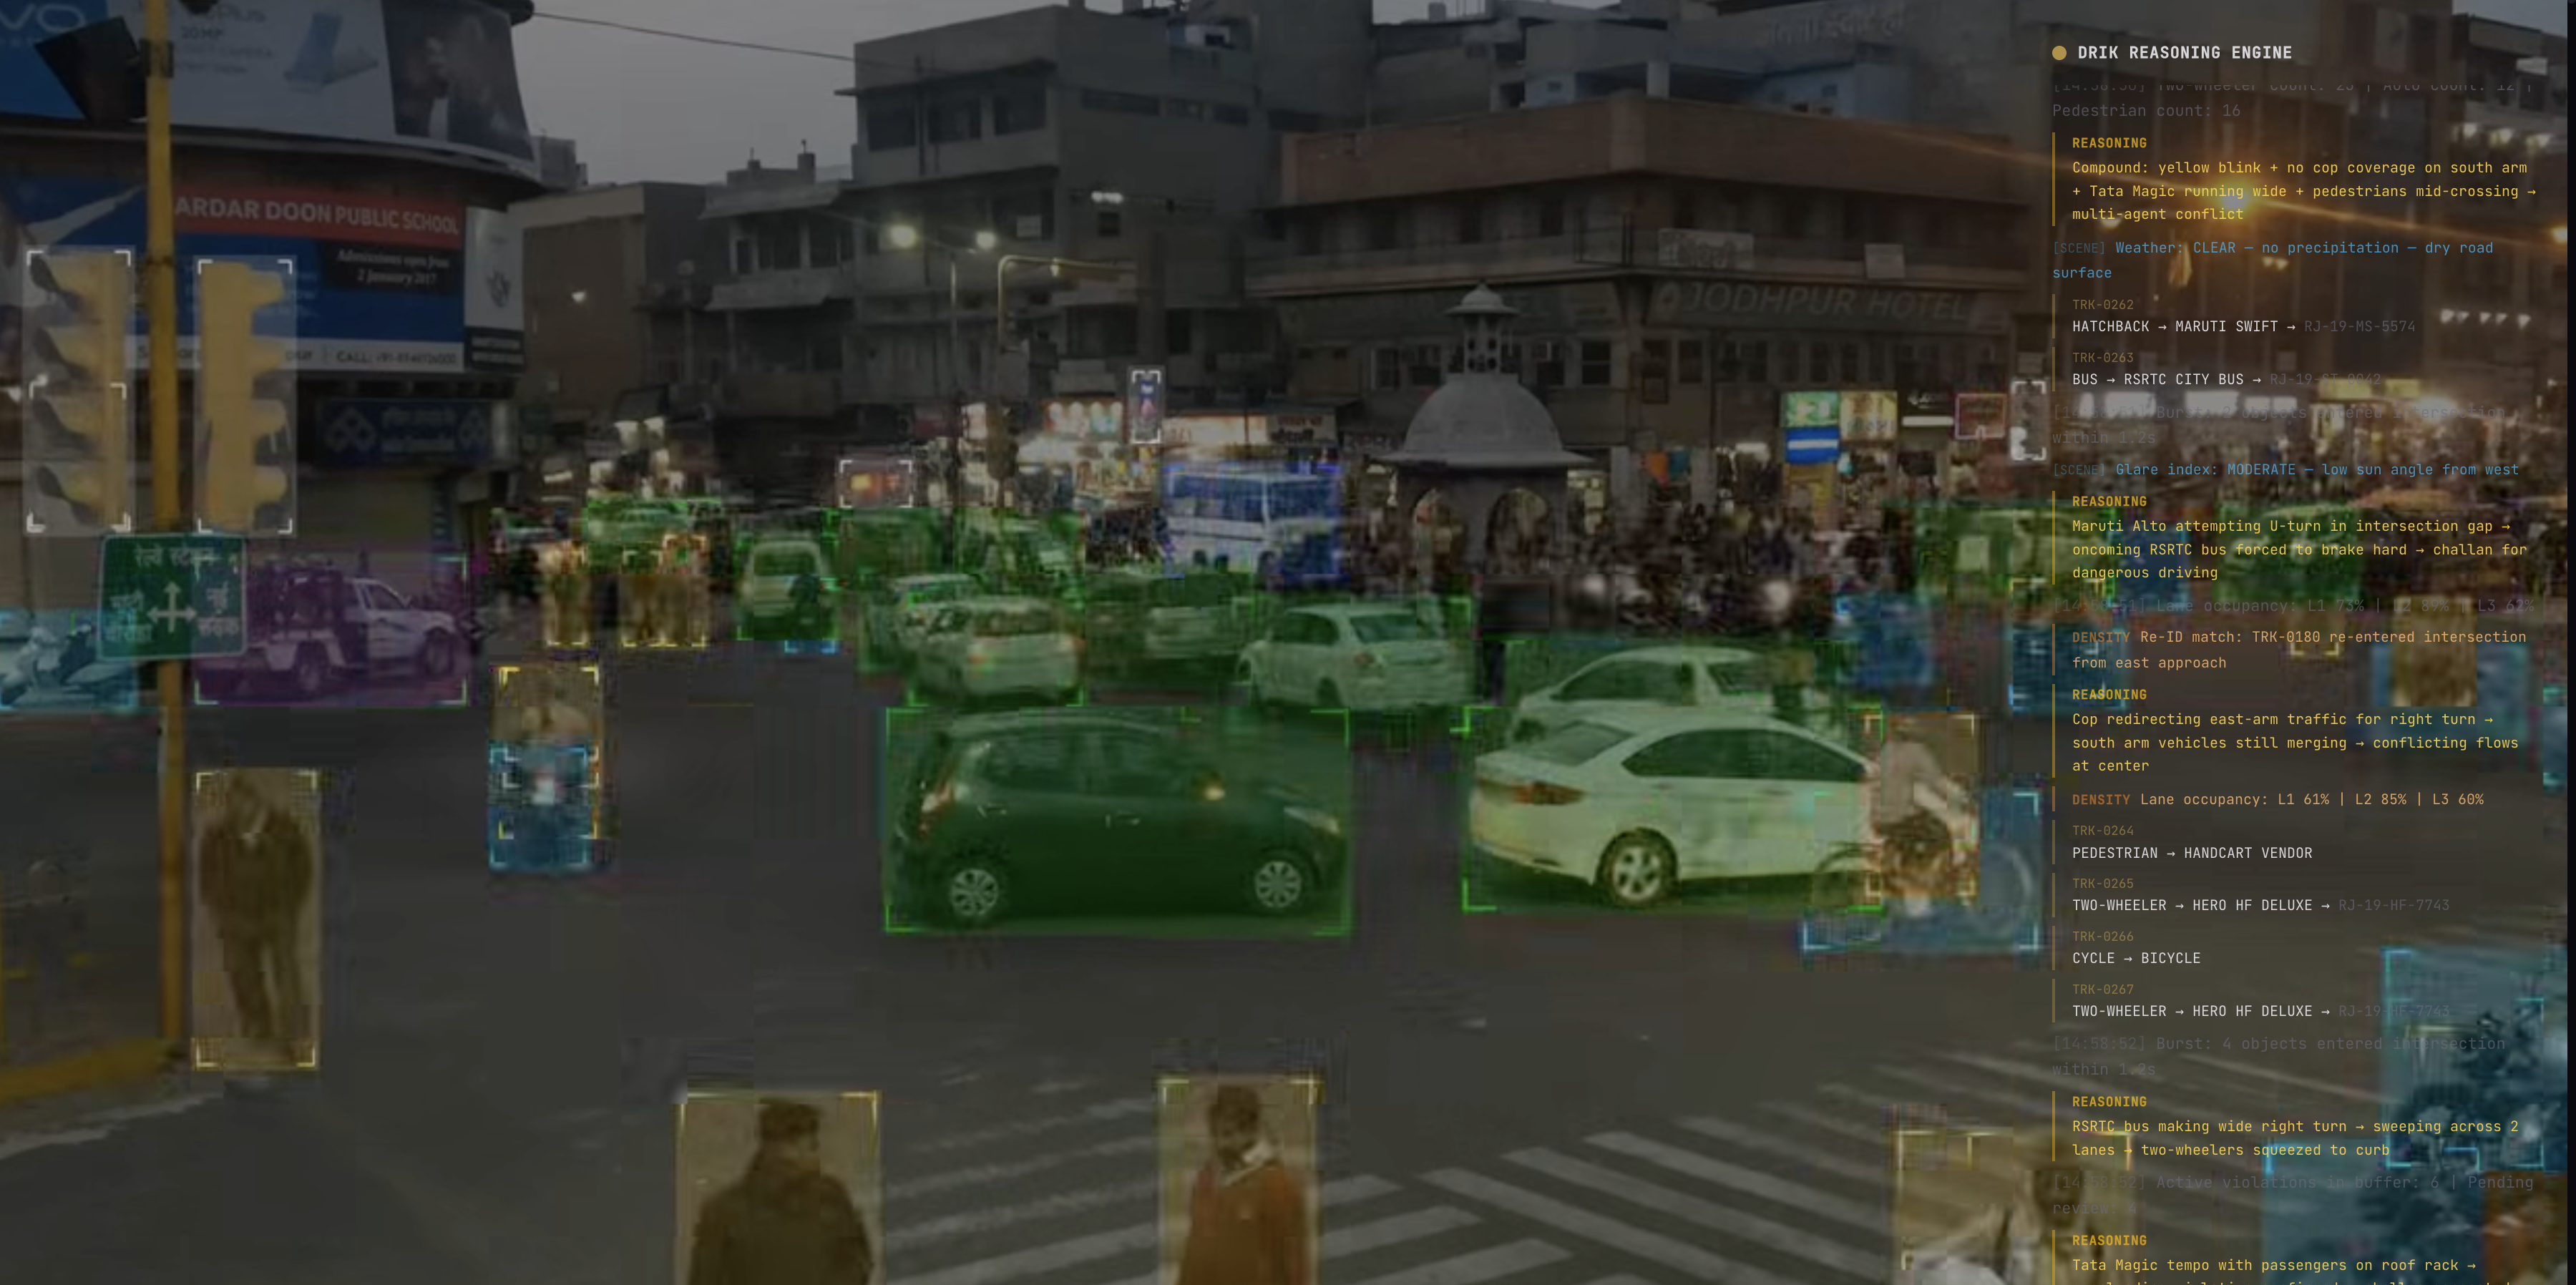
And we are building a system that does not just detect objects. It reasons about them. Reasoning, not detection, is the goal. A system that can look at an intersection and say: “That auto-rickshaw is about to cut off that bus, and the motorcyclist in the blind spot is at risk.”
That is Level 5 reasoning. We are not there yet. But the only way to get there is to train and test on the hardest possible data.
The Road Ahead
India adds 30,000 new vehicles to its roads every day. The traffic problem is not getting simpler. The camera infrastructure is growing but the intelligence is not.
We intend to change that.
Follow our work on Twitter and GitHub. We publish our datasets, benchmarks, and tools openly. If Indian traffic is the hardest CV problem, the solutions should belong to everyone.